Friday, February 22, 2019

IREIT Global (SGX:UD1U) 4Q18 Review


While 4Q18 results did not spring any major surprises, I noticed several salient points regarding IREIT Global (IREIT). Please refer to my initial piece here.

Gearing continues its gradual slide on upward revaluation of assets. As per the quarterly presentation, IREIT’s upward revaluation of its buildings accounted for the reduction of gearing. This is not surprising as rising rental rates in the office market and declining capitalisation rates (cap rate) in Germany has led to higher asset values. While its high gearing levels was always cited as a concern, I believe that the current level (36%) provides the REIT with some breathing room.


Loan has been refinanced at a lower rate, though borrowing sum has increased marginally. IREIT refinanced its outstanding loan of EUR 193.5 million with an 2.0% interest rate successfully with a new loan of EUR 200.8 million with a 1.7% effective interest rate. This lower interest rates will reduce the REIT’s interest expense by EUR 456k a year, though negligible on the REIT’s DPU level (0.07 cents).

However, to me, an  interesting piece of information is the tenure of the loan, that is a 7-year loan maturing in 2026. It is somewhat unusual for a bank to offer a loan beyond the lease profile of tenants. This either speaks of the bank’s lax credit policies, or perhaps, it is comfortable with the assets of the REITs that are presumably used as collateral for the loan. Which leads me on to the next point.


Office market remains hot in Germany. Vacancy rates continue to plummet in Germany as office take-up outstrips new supply of construction. Despite the hot property market, cosntruction activity remains subdued. This is important to note as it points to the likelihood that vacancy rates will remain low in the coming years, on the back of low supply of new office buildings. This is favourable for IREIT as its leases approach expiry in 2022. Should the office market remain tight and rental rates remain on an upward trajectory, the investor need not fear a concentrated tenancy profile. In fact, as highlighted in my previous post, IREIT may be a deep value stock, as investors can expect a jump in DPU come 2022. 

 Refer to the reports from JLL and Cushman & Wakefield for research details on the health of the Germany office real estate market.

Exchange rates on a downtrend. The Euro has been on a weakening trend over the last year due to a combination of politics and weaker economic data. The dividends for 2018 was hedged at 1.63, while the EUR/SGD has been declining steadily through 2018 and currently stands at 1.54. As IREIT hedges its dividends one year in advance, this implies that the the dividends for 2019 will be converted at progressively weaker levels. For this precise reason, I am not in a hurry to buy this REIT, and intend to accumulate in periods of sharp corrections, perhaps when the price is closer to 70 cents.


Conclusion

IREIT remains a deep-value REIT although in the short term, I am concerned about the effects of the weakening Euro. I am in no hurry to add this REIT to my portfolio, though it remains on my to-buy list should this REIT experience a correction.
Share:

Saturday, February 16, 2019

Banks Part II: Asset Quality


This is the second part of my series of the banking sector using the CAMELS framework. Please refer to my first part on capital adequacy here.

In my previous article on capital adequacy, I briefly described how the losses incurred from bad loans can wipe out a bank’s capital base. In this article, I will explore how this process works in further detail, as part of understanding a bank’s asset quality. A bank’s asset quality is paramount to its long term viability. Bad loans can haunt a bank for years, if not decades. Credit risk management is key not just for the viability of the bank, but for the economy as a whole.

It is important to keep in mind that defaults are part and parcel of doing business for a bank. It is regarded as a business expense that the bank tries to minimise, while maximising profits. Ultimately, it is a game of risk-reward, where taking on more risky loans translates into higher expected profits. Though when the business cycle turns south, a bank with more lax credit policies tends to experience a spike in defaults.

Recall how reckless lending practices in the US banking sector prior to 2008 led to the subprime mortgage crisis, which sparked the global financial crisis. Mounting losses in the subprime mortgage crisis led to banks failing as their capital levels were wiped out. In the aftermath of the crisis, banks have been subject to much higher regulations by authorities, with their risk appetite reined in. This has essentially transformed banks into somewhat stable, though less profitable entities as compared to the pre-crisis era.

A red flag that could indicate potential asset quality issues is a bank's historical loans growth. Historically across the world, rapid loans growth has tended to coincide with bubbles, particularly real estate. This was true in the US, which led to the US subprime mortgage. There are concerns that China is facing one now. Credit quality issues usually crop up several years after the rapid loans growth phase.

When a loan goes into default, it does not hit the bank’s capital, at least not immediately. This is because the first line of defence that a bank has is the profits from interest earned from its course of doing business. If a bank takes deposits and pays its depositors a rate of say, 2%, and lends it out at 6%, the bank earns an interest spread of 4%. If 1% of the loans go bad, the bank still ends up with a profit of 3%. It is only when the default rate exceeds 4%, that the bank’s shareholders begin to incur losses.

Profits as the first line of defence against a bad loans. This is because provisions are deducted against the banks operating profit. While I am jumping ahead of this section to the E-Earnings component, it is necessary to touch on this ratio in order to understand a bank’s asset quality. Basically the difference of the interest earned from the bank’s assets (loans, bonds that the bank is invested in) and that paid for its liabilities (deposits, bonds issued by the bank) is referred to as the Net Interest Income. Divide the Net Interest Income by the bank’s assets, and you get the Net Interest Margin (NIM), or the profit margin of a bank.

Naturally, a wider NIM provides the bank with a fatter cushion to absorb losses. Hence, in markets where central banks engage in financial repression, banks tend to have narrower NIMs, and by extension, lower cushion against deteriorating asset quality. The NIM gives you a rough indicator of the annual percentage of loans that a bank can afford to suffer defaults before the bank incurs losses. In short, a bank with lower profit margin will have a lower tolerance for defaults.


Provisioning

What is the exact link between bad loans and profitability? When a loan starts to demonstrate evidence of deteriorating credit quality, the bank is required to set aside a certain amount of its profits as provisions. For those unfamiliar with the concept of provisioning, it is the accounting practice of incurring an expense ahead of a probably expense. In layman terms, this is akin to setting aside some savings for a probable expense.

The section highlighted in orange below in DBS' 2Q18 Income Statement is the provisioning carried out for the quarter. Provisions are also known allowances.


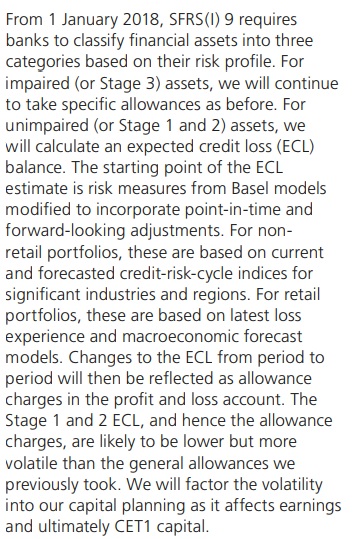
Under the current international standards, governed by IFRS 9, financial assets (including loans) are to be accounted for and provisioned using a three stage approach which captures progressive stages of credit deterioration. The three stages are: Stage 1 (Performing Loan), Stage 2 (Under-Performing) and Stage 3 (Impaired).


A defaulted loan, or a Stage 3 loan, is usually referred to as a Non-Performing Loan (NPL). Non-Perfoming Assets (NPA) includes NPL plus other assets of the bank that are in default such as bonds and derivatives. For example, if a bank had held Swiber, Perisai or Ezra bonds which defaulted in 2016-17, these bonds would be classified as NPAs.

The following excerpt is from DBS’ 2017 Annual Report.


The precise calculations for provisioning utilizes actuarial methods, such as the Expected Credit Loss (ECL) model which are somewhat technical and beyond the scope of this article. It is sufficient for the reader to understand that as the state of the loan deteriorates, say from stage 1 to 2, the bank is required to increase provisions. In layman terms, if the probability of an event increases, the individual is likely to increase his savings to cover that anticipated expense. This is conceptually similar to a parent starting an education fund following the birth of a child, and fine tuning the fund’s trajectory as the child grows up.

The bank’s provisions for impaired loans are transferred and stored in the balance sheet as a ‘loss allowance’. This loss allowance is utilized to offset NPL when they are written off the books. This is important to note that as writing-off the NPLs from the books against the loss allowance does not impact the income statement. Essentially, current accounting standards and regulations force banks to begin setting aside profits as a loan starts to show delinquency.  


Generally, for a loan that is in Stage 1 and 2, the provision required is calculated using a generic model and the amount allocated is referred to as ‘General Provision (GP)’. At Stage 3, the bank is required to provision to cover the unsecured portion of the loan, and this amount is referred to as ‘Specific Provision (SP)’. The SP required to cover an NPL does not have to match the full amount of the loan. This is because banks are usually able to recover at least a portion of the loan, more so if the loan is secured with collateral.

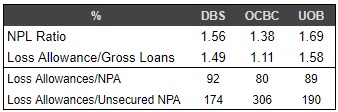
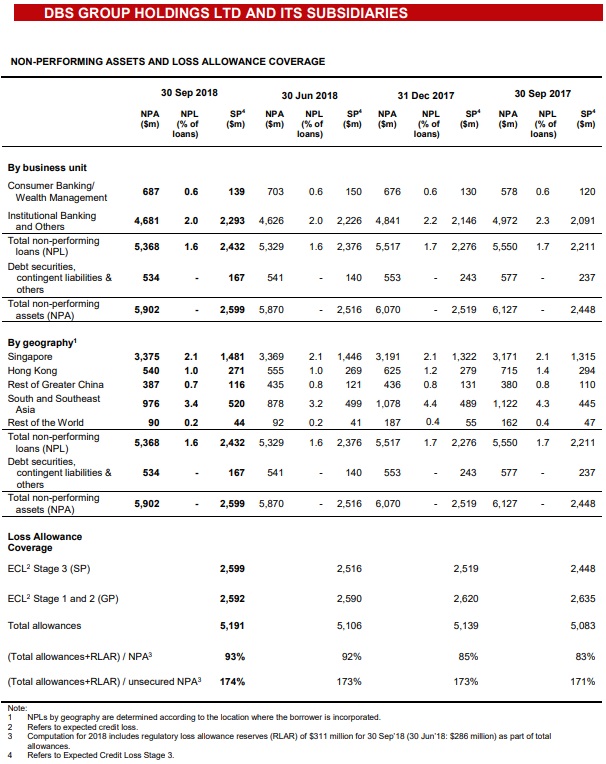
The last section, under the ‘Loss Allowance Coverage’, is a key indicator of a bank’s preparedness of its provisioning and allowances for bad loans. DBS’ Gross Loss Allowance Coverage is 93%, meaning that its allowances are only sufficient to cover 93% of its NPLs. However, as the loans are typically secured with collateral, the Loss Allowance cover of the unsecured portion is 174%.

Hence, we can see that the Singaporean banks are adequately covered in terms of provisions against their NPLs.


While the Chinese banks have similar levels of reported NPLs, there has been a lot of market suspicions surrounding the credibility of the numbers. Notwithstanding the accuracy of the Chinese banks’ true NPL levels, the Chinese banks have been provisioning aggressively over the last 3 years and conserving earnings by lowering the dividend payout despite rising profits. As a result of such heavy provisioning, the Loss Allowance has built up to relatively high levels, with the average Loss Allowance cover of NPLs to be 2x. In particular, ABC has built a very high level of Loss Allowance, 2.5x of its NPLs.


Aside from that, we will also examine a bank’s change in NPAs to get a better feel of its asset quality. Unfortunately this data is only available on an annual basis from the bank’s annual report, rather than quarterly reports. This is an excerpt from DBS’ 2017 Annual Report under “Credit Risk”.


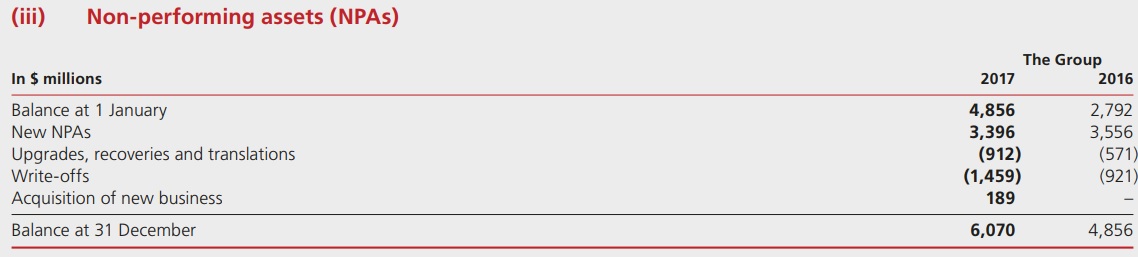
We can see how DBS’ NPA has evolved over 2016 and 2017. In 2017, DBS saw new NPAs of $3.396 billion, but experienced a reduction of $0.912 billion through assets recovery and upgrades (NPAs became performing assets once more) . The unsecured or unrecoverable portion of $1.459 billion was written off the books, which will entail cancelling it off against the loss allowances as discussed above. Studying this part gives you a clue as to how fast is the bank’s asset quality is deteriorating, and how fast is the bank scrubbing its books of its NPAs. We can see that although NPL formation was slightly lower in 2017 as compared to 2016, DBS scrubbed its books more aggressively in 2017. This led to NPLs rising by $1.2 billion in 2017, versus $2.1 billion in 2016.

So what is the impact of provisioning on profits? The more aggressively a bank provisions for impaired loans, the lower its reported profits are. As demonstrated above, Chinese banks have provisioned aggressively, resulting in a relatively high coverage ratio of its reported NPLs. On the other hand, under-provisioning may boost profits in the short term. However, if the bank's loans were to experience a sudden spike in defaults, the bank may have to increase provisions sharply, resulting in a profit plunge.

Occasionally, there are banks that artificially boost profits by reversing the provisions accumulated in the past. This is called 'writing-back' and is essentially dipping into allowances in order to pad up profits in the present. This is possible if the bank's asset quality improves, and finds itself with excess allowances on its balance sheet than is required by its regulators. I will address this in the article dealing with a bank's profitability. The take-away from this is that a bank has some leeway in 'smoothing' out its profits using its loss allowances to reduce or boost profits. This understanding is key to the next article dealing with a bank's profitability.

Summary

The health of a bank is underpinned by its asset quality. Banks are required to provision as soon as a loan begins to exhibit credit deterioration. This provision is deducted against the bank's operating profits, and stored in the balance sheet as a 'Loss Allowance'. Banks that are relatively underprovisioned may need provision more in future quarters, thus resulting in lower earnings and dividends in future. On the other hand, banks with loss allowances far in excess of their NPAs may reduce provisioning in future, thus supporting higher earnings and dividend payouts. This relationship between provisioning and profits is key for understanding a bank's profitability. 
Share:

Thursday, February 7, 2019

Banks Part I: Capital Adequacy


Banks typically feature in the average investor's portfolio as they are usually major components in the stock market index and are well-known brand names. Banks also make good dividend stocks in general, owing to their relative stability in dividend payments.

However, they are often the least understood of stocks in an investor's portfolio, from a fundamentals perspective, due to the complexities surrounding the sector. In this series of articles, I will attempt to simplify the standard framework utilised by institutions and regulators in analysing the banking sector. These are some of the factors that makes analysing banks a relatively challenging endeavor:
  1. Macroeconomic playsLarge banks are generally less susceptible to microeconomic or industry trends, such as fluctuations in commodity prices or boom and bust cycles of industries. They are, however, tied to the business cycle, fiscal and monetary policy on both domestic and global levels.
  2. Specialised financial statements. Interpreting a bank’s financial statement can be a daunting task for the uninitiated, even if the investor is familiar with interpreting financial statements of ordinary listed companies. The financial ratios for banks are highly specialized and specific to the sector, with increasing complexity over the years due to greater scrutiny by regulators.
  3. Heavily regulated sector. In the aftermath of the Global Financial Crisis, the global banking sector have been subject to heightened scrutiny and regulations by their governments. Banks are required to comply with a myriad of regulations and ratios, with increasingly complex regulatory requirements being enforced over the years.
A standard model used by regulators for monitoring banks is the CAMELS system. Though I am not advocating that the individual investor monitor banks in the same way that a central bank would, the framework provides a neat and orderly manner to evaluate the financial strength of a bank. Also, the CAMELS framework provides a set of financial ratios that makes banks comparable, even on an international basis. For practical purposes, I will only discuss the CAMEL of the model, omitting S or the Sensitivity component, since such data is often inaccessible, and also unnecessary for the individual investor to analyse.

C - Capital adequacy

A bank’s business model of taking deposits (borrowing) and giving out loans (lending) implies that banks inherently employ leverage. For every dollar of shareholders equity, an average bank borrows about$10 and lends it out, leading to a debt-to-equity ratio of 10x. In contrast, typical corporations are considered to be highly leveraged if their debt-to-equity ratio exceeds 1x or debt-to-asset ratio of 50%. For comparison sake, S-REITs have a statutory debt-to-asset ratio limit of 45% (debt-to-equity equivalent: 0.81x).

The tables below demonstrates simplified balance sheets and leverage levels of the largest Singaporean and Chinese banks as of 30th June 2018. The ratios below are strictly for the sake of illustrating how highly leveraged banks are, though in practice the financial industry employs highly specialised ratios to measure leverage and capital ratios.


Capital ratios have gained prominence in the aftermath of the Global Financial Crisis of 2008-2009 and meltdown of banks across the US and Europe (Iceland, UK). The subsequent European Debt Crisis of 2010-2012 which was triggered by Greece teetering on the edge of bankruptcy, further exposed the frailty of the global banking system. The reason is this- let us assume that a bank takes $9 of deposits for every $1 of shareholder equity and lends that entire $10. If the bank were to suffer a default rate of 10% or more, the bank is effectively insolvent as all shareholder equity is wiped out, and depositor funds are now at risk. This causes the bank to become vulnerable to a bank run, which could spread to healthy banks if the public confidence in the banking system erodes. 

This was the crux of the subprime mortgage crisis that precipitated the Global Financial Crisis, as the US banking system was loaded up with dubious or outright bad loans. At the height of the crisis, no one knew the true extent of bad loans (referred to as ‘toxic assets’) that each bank held, or which bank was effectively insolvent, thereby leading to a freeze in the entire financial system. It was only through massive intervention (read ‘bailout’) by the Federal Reserve and US government did the banking system unfreeze and the crisis end. Hence, from a regulator's perspective, a bank's shareholder equity functions as cushion that is able to absorb losses.

In general, the higher the leverage employed, the more vulnerable a bank is to failure if its assets go bad. The conventional ratios used to measure leverage for corporates are inadequate for financial institutions given the complexities of their balance sheet. This is because the ‘riskiness’ of a bank is not just measured by the degree of leverage employed, but also the quality of the assets that the borrowed money is deployed to. A bank that borrows $99 for every $1 of equity, but invests the entire $100 into risk-free government bonds is safer than a bank that borrows $9 for every $1 of equity and lends it out as subprime mortgages.

The international framework that was established under the Basel Accords has precise ratios to measure these risks. The ratios that deal specifically with a bank’s leverage and capital levels are referred to as Capital Adequacy Ratios. The broadest Capital Adequacy Ratio (CAR) consists of:


Tier One Capital refers to the 'highest' level of capital, which consist of common shareholder equity, reserves and a new class of perpetual bonds. This new class of perpetual bonds were introduced by the Basel III framework following the Global Financial Crisis, and their designated nomenclature by the industry is ‘contingent convertibles’. Under the current Capital Adequacy framework, these contingent convertibles are recognized as 'Additional Tier One Capital'.

Tier Two Capital refers to subordinated debt issued to institutional investors and are accepted as capital under Basel regulations. These securities are also classified as 'contingent convertibles' alongside the perpetual bonds described above.

Contingent convertibles were created to provide banks with an additional layer of buffer between common shareholders and senior-ranked bank creditors (depositors, senior bondholders). It should be noted that contingent convertibles are regarded as a distinct asset class of their own. This is because they have a 'loss-absorption' clause that allows the central bank and/or other regulators to convert these bonds into equity (without requiring the consent of bondholders, or to go through the legal system typical in the liquidation of a firm) in the event of a crisis that wipes out the bank's common equity. As they are highly-specialized bonds, I will devote a specific article to this asset class in a separate article. An example of this class of perpetual bond that was issued in November 2018 by UBS. 

Risk Weighted Assets refer to the assets on a bank’s balance sheet. The calculations are technical in nature but it is sufficient to say that the riskier the investment, the higher the Risk Weighted Asset is. In simple terms, the equation above describes the amount of capital that a bank needs to hold for an asset, adjusted for the risk of the asset. Government bonds are deemed to be risk-free and are ‘zero-risk weighted’, that is have a zero value when calculating the CAR. This implies that a bank who takes deposits and invests into government bonds will not be required to hold any capital for that portion of assets. On the other hand, a high risk loan will require a bank to hold a significant proportion of capital, thus limiting the amount of leverage a bank can take on risky loans.

The tables below are the formal measures of the banks’ leverage, or formally known as their capital adequacy ratios. The first line, Common Equity Tier 1 (CET1) Capital Ratio, measures the strictest  ('highest') form of capital, that is common shareholder equity and retained earnings. The next line adds perpetual bonds issued by the bank and certain regulatory reserves to the CET1. Finally, the third line shows the broadest capital adequacy ratio that captures Tier 1 and Tier 2 capital.


The higher the ratios, the more capitalised the bank is, or the lower the leverage level of the bank. In the case of the Singaporean banks, UOB stands out for its higher capital ratios as compared to the other two banks. But how do these ratios stack up against regulatory requirements? Basel accords prescribe a minimum of 6% for CET1 levels but the Monetary Authority of Singapore (MAS) has set a higher requirement of 9% for banks under its purview.


To complicate matters, banks that are designated as domestic systemically important banks (D-SIBs) by MAS are required to hold higher levels than the chart above. Beyond mentioning the above, I will delve no further into regulatory requirements on this aspect. Fortunately for investors, banks’ financial statements typically disclose the minimum levels required by their respective regulator, that is, their central bank. The following extract is from DBS’ financial statements as of 2Q18.


By now, the reader may presume that a better capitalised (and lower leveraged) bank is superior to that of a lower capitalised bank. However, that solely depends on the stakeholder. In the eyes of the government and central bank, higher capital ratios are definitely preferable as it reduces the risk of a financial crisis in the banking system.

As an individual depositor, you would sleep better knowing that your bank if your bank is taking on less risk with your money. Also, if you are invested into bonds that are issued by a bank, you would prefer a stronger bank. However, as a shareholder of a bank stock, this would depend on your risk appetite.

A bank with lower capital ratios could indicate that the bank is taking on more risk (higher leverage), and as such could potentially generate more profits during an upswing in the business cycle. Banks with lower capital ratios enjoy a higher return on equity by virtue of the smaller equity denominator.

Basically, since shareholders enjoy the residual profit of a business (after paying off all the other stakeholders including debtors), the larger the equity base, profits have to be shared across a larger base. If a bank’s core capital ratios are deemed to be too low, the bank will be required to raise new capital in the form of rights or a secondary IPO of shares, which is dilutive to existing shareholders. I will explore this issue of profitability in an upcoming article in this series on the banking sector.

Summary

Banks are essentially heavily leveraged entities. Central banks regulate the amount of leverage that a bank can take, and measure them using the International Framework established by the Basel Accords. These ratios are known as the Capital Adequacy Ratios. Higher Capital Adequacy Ratios imply that a bank is better prepared to withstand a crisis. However, the flip-side of being very well capitalised is lower profitability for its shareholders. Investors need to keep this in mind when looking at bank stocks since profitability ratios tend to correlate negatively with capital ratios. Understanding the perspective of a regulator is important as it will allow the investor to be aware of the constraints that a bank experiences.

Share:

Monday, February 4, 2019

Happy Chinese New Year!


Wishing my readers a prosperous year ahead! I will take a break from posting about financial matters and instead post some my favourite hong baos for this year, and from my collection over the years.

Let's kick it off with UOB's geometric pig motif that is quite unique. The texture of the packets is fabric-like and the gold overlay really stands out


Deutsche Bank's pop-up butterflies for 2019 deserves a mention.


Skandinaviska Enskilda Banken's hong bao from a previous year.


Barclays hong baos are known for their vivid and intense zodiac themes.


Aberdeen's paper cutting hong bao of 2012 is another favourite of mine. The delicate dragon-phoenix cutting against a gold backdrop is simply amazing.


My collection of Credit Suisse hong baos. I have ten animals of the zodiac thus far, with just two more years to go before I have a full cycle. As one of the very few bank that have been producing hong baos according to the Chinese Zodiac faithfully over the years (not to mention with much effort and quality), I look forward with much eagerness to their annual production.


But for 2019, UBS takes the crown with their avian-themed hong baos. The visually-intricate and rich design,  velvet-like fabric material coupled with gold overlay and embossment of the birds and floral motifs puts their hong baos a league above all the other banks.

祝大家新的一年 财源滚滚 万事如意 阖家平安

Share:

Saturday, February 2, 2019

REITs Part II: Interest Rates


This is the second part of my analyses of REITs. Refer to Part 1 here.

The first part deals with the components of a dividend yield, where I mentioned that the risk-free rate sets the base for a REIT's dividend yield. In this post, I will focus on this component, as it is a long term driver of REIT yields as a sector.

Brief history of interest rates. Broadly speaking, as REITs trade like junk/high yield bonds, changes in government bond yields generally drive dividend yields. Institutional investors like pension funds, insurance firms, asset management companies and even central banks, tend to perceive REITs relative to government and corporate bond yields, especially since the Global Financial Crisis of 2009. Recall that at the height of the financial crisis, the Federal Reserve brought its policy rate to an unprecedented zero percent. Even with that, lending activity remained depressed and total loans in the system fell as US households deleveraged after the property bubble burst.

While short term interest rates were close to zero, longer-term interest rates remained somewhat higher. This led the Federal Reserve to embark on a series of government bond buying sprees. This entailed the central bank going into the government bond market, and buying bonds using what was essentially digital money created out of thin air. This was known as the Quantitative Easing (QE) program.

The net result of several rounds of QE led to lower bond yields and a lot more cash in the financial system. Note that while the official interest rate (Fed Fund Rate) and the US 2-year government bond was at 0%, the 10-year and 30-year government bond yields declined steadily between 2010 and 2015. This was a direct consequence of the Federal Reserve purchasing more than USD 2 trillion of US Government bonds under its Quantitative Easing program. (technical way of saying that the Federal Reserve 'printed' USD 2 trillion and bought government bonds). Naturally, by pushing down the 10 and 30-year government bond yields, this results in lower borrowing costs for companies that are issuing long-tenure bonds and even individuals seeking mortgages.


If you thought low bond yields are already bad enough, other major economies of the developed world, namely Europe and Japan took this unconventional monetary policy to new heights, by pushing interest rates and government bond yields into negative territory. The goal of this radical monetary policy was to lower borrowing costs so as to stimulate economic activity, but the side effect was inflation of asset prices globally (primary beneficiaries were stocks and real estate).

In case you were wondering, a bond with a negative yield does not mean a negative coupon. It just means that the bondholder will eventually receive his principal upon bond maturity that is lower than his initial purchase price, with the coupons collected insufficient to compensate for that difference.

How does this tie into REITs? Institutional investors drive global markets. They run the gamut from hedge funds, family offices, banks, treasury desks of large corporations, to central banks and sovereign wealth funds. They all have varying degrees of risk appetites and investment horizons, but of interest to us are what are known as 'Liability Driven Investors' (LDIs). LDIs are basically investors that make investment decisions with the primary goal of meeting future liabilities. Classic examples of LDIs are pension funds and insurance firms, who must invest not with the primary goal of short term profits, but must generate returns to meet expected payouts in the present as well as remain solvent for the distant future.

Think about your own personal insurance policies (perhaps life, or even medical insurance) from the perspective of your insurer. Your insurance firm must be able to generate sufficient returns from its portfolio not just to meet a claim anytime between the present and decades from now, but generate profits to satisfy its own shareholders at the same time. As such, LDIs typically rely on stable but low volatility investments to meet its ongoing obligations. In the pre-crisis era, bonds constituted the bulk of an LDI's portfolio. However, zero/negative interest rates and very low bond yields have made traditional LDI asset allocation very unsuitable for obvious reasons. This has led to LDIs allocating more assets to stocks in a bid to generate better returns, and REITs have been a natural alternative to bonds owing to their relatively stable dividend yields. It is this relationship that has transformed REITs into a quasi-junk bond investment class.

The relationship between the government bond yield and REITs is more apparent in the large-cap and liquid REITs as they are most likely to be held by institutions as opposed to their counterparts that are less liquid or of smaller REITs. The chart below shows the dividend yield of CapitaLand Malls Trust (CT) and CapitaLand Commercial Trust (CCT), as compared against the yield of a 5-year Singapore Government Bond (SGB). While not perfect, there is a reasonably strong correlation between the movement of dividend yields and bond yields. For the mathematically inclined, the correlation factor between these REITs and the 5-year SGB is between 0.6-0.7. 
From the chart above, we can see that the two REITs trade at a fairly constant premium to the SGB, in what is the risk-premium that investors receive for taking on risks as described in Part 1. Here, we can see with clarity that movements in the underlying bond yields are a causative factor behind changes in the REITs' dividend yields. Bearing in mind that dividend yields are a function of DPU dividend by a REIT's unit price, dividend yields can only respond to a change in SGB yields through a change in unit price. Therefore, if bond yields were to rise sharply suddenly, dividend yields would follow suit, but only through a fall in unit price. 

It is through this mechanism that we can see why REITs tend to perform poorly in periods of rising bond yields, despite the broader stock market faring well. Likewise, falling bond yields globally since late 2018 has translated in a broad based REIT rally, simply because REIT dividend yields are falling, tracking the underlying fall in bond yields. 

So when do REITs generally perform well? The sweet spot where most REITs outperform or perform as well as regular stocks is in a 'goldilocks-like' situation of modest economic growth. In this climate of lukewarm growth and business sentiments, central banks tend to keep interest rates low and monetary conditions easy. On the other hand, strong economic growth usually means higher interest rates, such as the US in 2017-18, which led to bond yields rising and ultimately hurt REITs globally. On the other hand, recessionary economic conditions will also hurt REITs in general, as vacancy rates can be expected to rise and rental rates fall (as how certain industrial REITs were impacted in the aftermath of the crude oil price plunge in 2014). REITs with a more resilient lease structure (longer leases, defensive sectors such as healthcare) will generally perform better in this environment as bond yields will fall.

So far I have only touched on the market aspect of dividend yields and bond yields/interest rates. Bond yields also affect a REIT's fundamentals in terms of its interest expense, since all REITs are leveraged. Rising interest rates will result in lower DPU, holding all else constant. Since REITs have the ability to take out bank loans or issue bonds, rising interest rates and bond yields will generally affect their interest expense.

Also, interest rates feature heavily in the calculus of acquiring new assets. The REIT manager will have to factor in the prevailing cost of debt (interest cost) plus cost of equity, if the REIT has to raise fresh equity. Should the cost of debt and/or cost of equity be higher relative to the yield of the asset-that-is-to-be-acquired, the deal will end up to be DPU dilutive. Therefore, interest rates can and do impact the viability of new assets. Generally, a lower interest rate makes an acquisition more viable. Investors familiar with the S-REIT space would have taken note that S-REITs have been exploring aggressively in Europe over the last few years. It is also no coincidence that interest rates in the Eurozone are very low, making it viable for REIT managers to borrow in EUR and purchase yield-accretive assets there.

Therefore REITs are generally very sensitive to interest rates (more so than stocks in general) as rising interest rates will have a two-fold effect:

  1. Market effect - rising bond yields means that the REIT's dividend yields are pressured to rise (higher dividend yield implies lower REIT price)
  2. Fundamental effect - rising bond yields translates directly into higher interest expense (lower DPU). A lower DPU compounds the market effect described above, since if dividend yields are rising, and DPU is falling, the unit price must fall by a larger quantum. 
A simple example to demonstrate this is with a hypothetical REIT with a DPU of 6 cents and a unit price of $1.00. This translates into a dividend yield of 6.0%. Let us assume that interest rates were to rise by 0.50%, and that this hypothetical REIT's market dividend yield follows suit. The outcome are as the following:


Here, we can see how rising interest rates are a double-whammy for REITs. Conversely, in the same example, if interest rates were to fall by 0.50% instead, the unit price would rise to $1.09 just accounting for the immediate market effect. A higher DPU of 6.5 cents, due to lower interest expense would work out to a unit price of $1.18.


Please note that the calculations above are purely hypothetical as the Fundamental Effect depends on the REIT's debt profile. If the REIT has a debt profile of long-term fixed rate loans or bonds, the interest costs will not be impacted by short term fluctuations in interest rates. In this case, the timing of when the REIT has to roll over its debt is critical. On the other hand, a REIT with a larger exposure to floating interest rates will see greater variability in its interest expense. Clearly, the examples above assumes that the REIT's debts consist of floating rate loans and bonds (perhaps tied to the SIBOR)

Summary
Interest rates and bond yields are the tide that lifts and lowers the REITs as a sector. A REIT investor ignores the broader environment of interest rates, to the peril of his portfolio. Knowing this will help you to understand why REITs tend to sell-off even if the broader stock market is not. Or why REITs seem to participate in a stock rally at times, and at other times, remain on the sidelines.
Share: