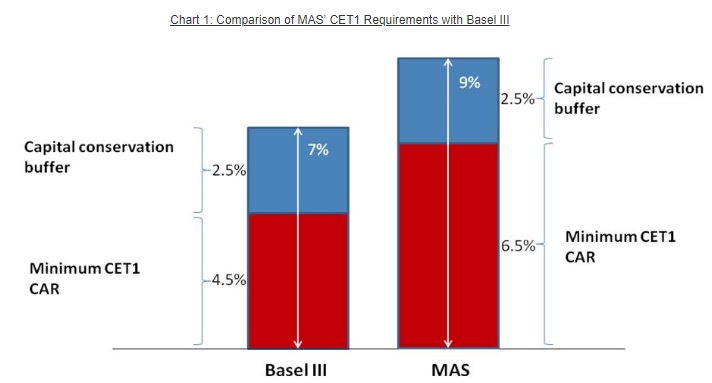
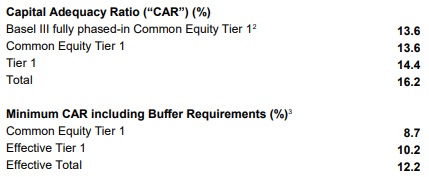
This is the second part of my series of the banking sector using the CAMELS framework. Please refer to my first part on capital adequacy here.
In my previous article on capital adequacy, I briefly described how the losses incurred from bad loans can wipe out a bank’s capital base. In this article, I will explore how this process works in further detail, as part of understanding a bank’s asset quality. A bank’s asset quality is paramount to its long term viability. Bad loans can haunt a bank for years, if not decades. Credit risk management is key not just for the viability of the bank, but for the economy as a whole.
It is important to keep in mind that defaults are part and parcel of doing business for a bank. It is regarded as a business expense that the bank tries to minimise, while maximising profits. Ultimately, it is a game of risk-reward, where taking on more risky loans translates into higher expected profits. Though when the business cycle turns south, a bank with more lax credit policies tends to experience a spike in defaults.
Recall how reckless lending practices in the US banking sector prior to 2008 led to the subprime mortgage crisis, which sparked the global financial crisis. Mounting losses in the subprime mortgage crisis led to banks failing as their capital levels were wiped out. In the aftermath of the crisis, banks have been subject to much higher regulations by authorities, with their risk appetite reined in. This has essentially transformed banks into somewhat stable, though less profitable entities as compared to the pre-crisis era.
A red flag that could indicate potential asset quality issues is a bank's historical loans growth. Historically across the world, rapid loans growth has tended to coincide with bubbles, particularly real estate. This was true in the US, which led to the US subprime mortgage. There are concerns that China is facing one now. Credit quality issues usually crop up several years after the rapid loans growth phase.
A red flag that could indicate potential asset quality issues is a bank's historical loans growth. Historically across the world, rapid loans growth has tended to coincide with bubbles, particularly real estate. This was true in the US, which led to the US subprime mortgage. There are concerns that China is facing one now. Credit quality issues usually crop up several years after the rapid loans growth phase.
When a loan goes into default, it does not hit the bank’s capital, at least not immediately. This is because the first line of defence that a bank has is the profits from interest earned from its course of doing business. If a bank takes deposits and pays its depositors a rate of say, 2%, and lends it out at 6%, the bank earns an interest spread of 4%. If 1% of the loans go bad, the bank still ends up with a profit of 3%. It is only when the default rate exceeds 4%, that the bank’s shareholders begin to incur losses.
Profits as the first line of defence against a bad loans. This is because provisions are deducted against the banks operating profit. While I am jumping ahead of this section to the E-Earnings component, it is necessary to touch on this ratio in order to understand a bank’s asset quality. Basically the difference of the interest earned from the bank’s assets (loans, bonds that the bank is invested in) and that paid for its liabilities (deposits, bonds issued by the bank) is referred to as the Net Interest Income. Divide the Net Interest Income by the bank’s assets, and you get the Net Interest Margin (NIM), or the profit margin of a bank.
Naturally, a wider NIM provides the bank with a fatter cushion to absorb losses. Hence, in markets where central banks engage in financial repression, banks tend to have narrower NIMs, and by extension, lower cushion against deteriorating asset quality. The NIM gives you a rough indicator of the annual percentage of loans that a bank can afford to suffer defaults before the bank incurs losses. In short, a bank with lower profit margin will have a lower tolerance for defaults.


Provisioning
What is the exact link between bad loans and profitability? When a loan starts to demonstrate evidence of deteriorating credit quality, the bank is required to set aside a certain amount of its profits as provisions. For those unfamiliar with the concept of provisioning, it is the accounting practice of incurring an expense ahead of a probably expense. In layman terms, this is akin to setting aside some savings for a probable expense.
The section highlighted in orange below in DBS' 2Q18 Income Statement is the provisioning carried out for the quarter. Provisions are also known allowances.

The section highlighted in orange below in DBS' 2Q18 Income Statement is the provisioning carried out for the quarter. Provisions are also known allowances.

Under the current international standards, governed by IFRS 9, financial assets (including loans) are to be accounted for and provisioned using a three stage approach which captures progressive stages of credit deterioration. The three stages are: Stage 1 (Performing Loan), Stage 2 (Under-Performing) and Stage 3 (Impaired).

A defaulted loan, or a Stage 3 loan, is usually referred to as a Non-Performing Loan (NPL). Non-Perfoming Assets (NPA) includes NPL plus other assets of the bank that are in default such as bonds and derivatives. For example, if a bank had held Swiber, Perisai or Ezra bonds which defaulted in 2016-17, these bonds would be classified as NPAs.
The following excerpt is from DBS’ 2017 Annual Report.
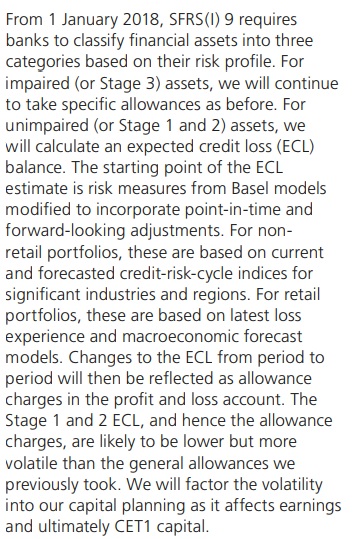
The precise calculations for provisioning utilizes actuarial methods, such as the Expected Credit Loss (ECL) model which are somewhat technical and beyond the scope of this article. It is sufficient for the reader to understand that as the state of the loan deteriorates, say from stage 1 to 2, the bank is required to increase provisions. In layman terms, if the probability of an event increases, the individual is likely to increase his savings to cover that anticipated expense. This is conceptually similar to a parent starting an education fund following the birth of a child, and fine tuning the fund’s trajectory as the child grows up.
The bank’s provisions for impaired loans are transferred and stored in the balance sheet as a ‘loss allowance’. This loss allowance is utilized to offset NPL when they are written off the books. This is important to note that as writing-off the NPLs from the books against the loss allowance does not impact the income statement. Essentially, current accounting standards and regulations force banks to begin setting aside profits as a loan starts to show delinquency.
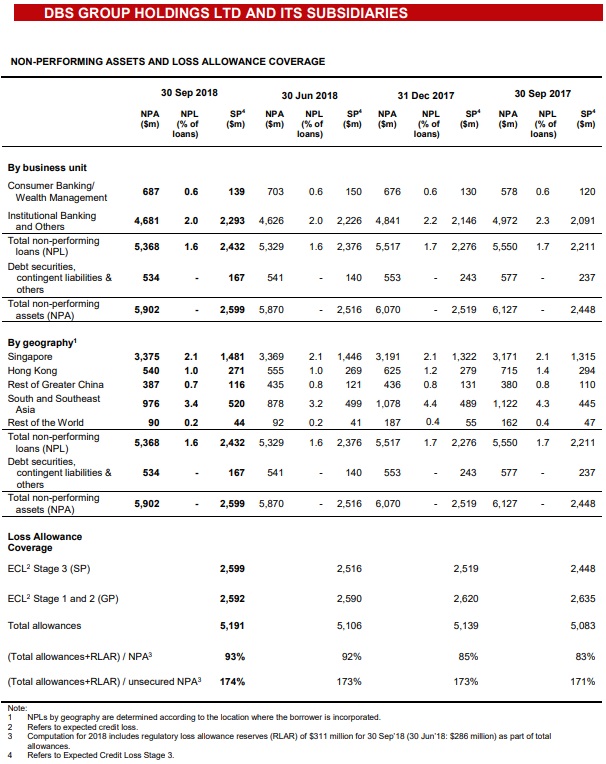
Generally, for a loan that is in Stage 1 and 2, the provision required is calculated using a generic model and the amount allocated is referred to as ‘General Provision (GP)’. At Stage 3, the bank is required to provision to cover the unsecured portion of the loan, and this amount is referred to as ‘Specific Provision (SP)’. The SP required to cover an NPL does not have to match the full amount of the loan. This is because banks are usually able to recover at least a portion of the loan, more so if the loan is secured with collateral.
The last section, under the ‘Loss Allowance Coverage’, is a key indicator of a bank’s preparedness of its provisioning and allowances for bad loans. DBS’ Gross Loss Allowance Coverage is 93%, meaning that its allowances are only sufficient to cover 93% of its NPLs. However, as the loans are typically secured with collateral, the Loss Allowance cover of the unsecured portion is 174%.
Hence, we can see that the Singaporean banks are adequately covered in terms of provisions against their NPLs.
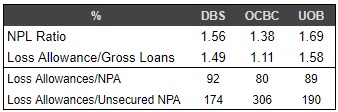
While the Chinese banks have similar levels of reported NPLs, there has been a lot of market suspicions surrounding the credibility of the numbers. Notwithstanding the accuracy of the Chinese banks’ true NPL levels, the Chinese banks have been provisioning aggressively over the last 3 years and conserving earnings by lowering the dividend payout despite rising profits. As a result of such heavy provisioning, the Loss Allowance has built up to relatively high levels, with the average Loss Allowance cover of NPLs to be 2x. In particular, ABC has built a very high level of Loss Allowance, 2.5x of its NPLs.

Aside from that, we will also examine a bank’s change in NPAs to get a better feel of its asset quality. Unfortunately this data is only available on an annual basis from the bank’s annual report, rather than quarterly reports. This is an excerpt from DBS’ 2017 Annual Report under “Credit Risk”.
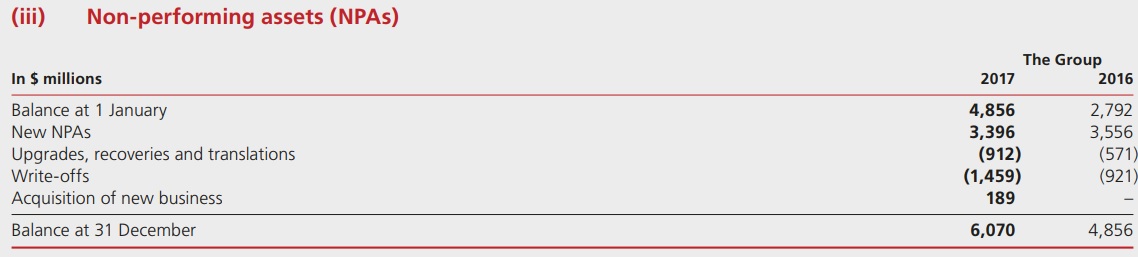
We can see how DBS’ NPA has evolved over 2016 and 2017. In 2017, DBS saw new NPAs of $3.396 billion, but experienced a reduction of $0.912 billion through assets recovery and upgrades (NPAs became performing assets once more) . The unsecured or unrecoverable portion of $1.459 billion was written off the books, which will entail cancelling it off against the loss allowances as discussed above. Studying this part gives you a clue as to how fast is the bank’s asset quality is deteriorating, and how fast is the bank scrubbing its books of its NPAs. We can see that although NPL formation was slightly lower in 2017 as compared to 2016, DBS scrubbed its books more aggressively in 2017. This led to NPLs rising by $1.2 billion in 2017, versus $2.1 billion in 2016.
So what is the impact of provisioning on profits? The more aggressively a bank provisions for impaired loans, the lower its reported profits are. As demonstrated above, Chinese banks have provisioned aggressively, resulting in a relatively high coverage ratio of its reported NPLs. On the other hand, under-provisioning may boost profits in the short term. However, if the bank's loans were to experience a sudden spike in defaults, the bank may have to increase provisions sharply, resulting in a profit plunge.
Occasionally, there are banks that artificially boost profits by reversing the provisions accumulated in the past. This is called 'writing-back' and is essentially dipping into allowances in order to pad up profits in the present. This is possible if the bank's asset quality improves, and finds itself with excess allowances on its balance sheet than is required by its regulators. I will address this in the article dealing with a bank's profitability. The take-away from this is that a bank has some leeway in 'smoothing' out its profits using its loss allowances to reduce or boost profits. This understanding is key to the next article dealing with a bank's profitability.
Summary
Summary
The health of a bank is underpinned by its asset quality. Banks are required to provision as soon as a loan begins to exhibit credit deterioration. This provision is deducted against the bank's operating profits, and stored in the balance sheet as a 'Loss Allowance'. Banks that are relatively underprovisioned may need provision more in future quarters, thus resulting in lower earnings and dividends in future. On the other hand, banks with loss allowances far in excess of their NPAs may reduce provisioning in future, thus supporting higher earnings and dividend payouts. This relationship between provisioning and profits is key for understanding a bank's profitability.