Showing posts with label SGX. Show all posts

Thursday, March 14, 2019

REITs III: Exchange Rates


This is Part III of my series on REITs. Please refer to Part I and Part II.

My series on REITs will not be complete without touching on exchange rate, given the internationalisation of the SGX as a major listing hub for REITs all over the world. Even blue chip REITs which were pure-plays in the Singapore space, such as Capitaland Commercial Trust, have gone abroad in hunt of fresh assets. As such, this introduces a new risk that investors cannot afford to ignore, or even take as a trivial risk. Given that the vast majority of REITs are listed in SGD but have exposure to various currencies globally, we have to study the SGD itself. As all Singaporean investors would be acutely aware, the SGD has been on a long term uptrend against most major currencies globally.

Central Bank Policy

At present, conventional monetary policy across the world usually revolves around setting interest rates to steer growth and inflation rates. Some smaller countries prefer to outsource this task to major central banks by pegging their currencies to that of their major trading partners, e.g. Hong Kong and the petro-states of the Middle East to the USD. The downside of maintaining a rigid currency peg (known as a ‘hard peg’) is that the central bank loses all control over its domestic interest rates, and is required to have ample reserves to maintain the credibility of a peg. This is because a peg means that the central bank is playing the role of a money changer for all participants in the economy. It must be able to satisfy all demand and supply for currency at the prevailing rate. A good case study is Thailand in the 1990s, which precipitated the Asian Financial Crisis. Basically, as foreign investors sold their THB to exit the market, the central bank saw its reserves deplete as it sought to defend the peg. 

To maintain a currency peg, the Central Bank has to act as the ultimate money changer, buying and selling the local currency at the pegged rate. For example, let us assume that the Monetary Authority of Singapore (MAS) were to suddenly peg the SGD to say, 1.30 against the USD. In this scenario, MAS would buy USD from exporters, inward bound investors and tourists, in exchange for SGD. This is an easy thing to do, as MAS can just ‘print’ the additional SGD in exchange for the USD received. The SGD enters into circulation for use in the broader economy, and MAS keeps the USD received as part of its foreign reserves. This is essentially what a central bank’s foreign reserves are- a hoard of foreign currencies accumulated through the course of action of a central bank’s attempt to control its currency.

On the other hand, let us consider what happen when an importer brings goods in, or a Singaporean investor buys US stocks. That person is basically offering to sell his SGD in exchange for foreign currency in order to fund his purchase or investment. MAS will therefore dip into its reserves, take the USD out in exchange for the SGD.

In the former transaction, MAS is able to print an infinite amount of SGD when exporters or inward bound investors demand for the local currency at 1.30. However, in the latter scenario, when importers or outward bound investors want to dispose of their SGD, MAS has a finite supply of foreign reserves that it can use to meet the demand for foreign currency.

Should the selling of local currency in exchange for foreign currency overwhelm the central bank’s reserves, the central bank will be unable to defend the currency at that level, and will be force to devalue the currency. This happened to the Thai Baht (THB) in 1997, when the Central Bank, the Bank of Thailand, depleted its reserves defending its currency peg then. The government was forced to allow the THB to float as it did not have the reserves to meet the flood of THB sellers. The breaking of the currency peg led to the THB going into freefall and this was the opening chapter of the crisis that ravaged Asia.

Macroeconomic Environment of Singapore

Singapore runs a massive Current Account Surplus, as a result of its strong net exports position and high national savings rate. A high national savings rate is due to household savings and government savings (fiscal surplus). Further reading on this issue (which is rather academic) can be found here. As explained above, this implies that there is a net inflow of foreign currencies into Singapore, which allows MAS to accumulate foreign currencies if it wishes to prevent the currency from appreciating sharply.


The result of the Current Account Surplus above has translated into the chart below, which demonstrates Singapore's long term uptrend of foreign reserves. We will explore further below the relationship between the current account surplus, reserves and the SGD.


Monetary Authority of Singapore (MAS) Policy

MAS has adopted a ‘soft peg’ regiment for the SGD. The SGD is permitted to fluctuate within a narrow band against a trade-weighted basket of currencies. MAS effects it monetary policy through controlling the position of the center, slope and width of the currency band. While it does not disclose the precise nature of these details, many large banks have reversed engineered the basket. The basket generally reflects the trade partners of Singapore, with the USD, MYR and CNH constituting the bulk of the basket. The following is the currency pathway of the SGD as set by MAS over the years, with the center and bands estimated by Morgan Stanley. The black bands are the 'guard rails' that MAS permits the SGD to drift within.


MAS intervenes in a similar manner as described in the 'hard peg' scenario earlier. It buys foreign currencies in exchange for SGD when the SGD presses against the ceiling of the band, and supports the SGD by selling its foreign reserves when the currency approaches the floor. It is this process of keeping the SGD within this band, that MAS accumulates its foreign reserves. This is because as demand for SGD exceeds supply due to the strong current account surplus, this will naturally lead to an appreciation of the SGD. MAS intervenes to limit the degree of intervention by selling SGD that it 'prints', in exchange for foreign currency that becomes part of MAS' reserves.

Reading the MAS semi-annual monetary policy statements will give you an insight into how MAS steers the currency. The following is extracted from MAS’ October 2018 statement, when the central bank decided to increase the slope of the currency policy band.

14.   MAS has therefore decided to increase slightly the slope of the S$NEER policy band. The width of the policy band and the level at which it is centred will be unchanged. This measured adjustment follows the slight increase in the slope of the policy band in April 2018 from zero percent previously, and is consistent with a modest and gradual appreciation path of the S$NEER policy band that will ensure medium-term price stability.

We can easily conclude from the chart above that MAS has deliberately kept the SGD on a steady and controlled upward or appreciating pathway in the long run. Even in times of economic weakness, MAS kept the slope flat, implying that the SGD remained flat against the major currencies. Historically, MAS has kept the currency on an upward slope of 2% in times of strong economic growth, and flat or 0% during periods of economic weakness. The current slope is estimated to be 1%, or in other words, the SGD is expected to strengthen at a rate of 1% per annum against the basket of currencies.

We can see below how the SGD has generally appreciated against the major currencies globally.

The SGD has held up well against other Asian currencies as well, though the RMB stands out for holding up against the SGD. This is somewhat expected as China has been an export powerhouse and has amassed the largest foreign reserves in the world (north of USD 3 trillion as of early 2019). 

What are the implications for SREITs?

Since the SGD tends to be on an uptrend against major currencies for the vast majority of the majority of the time, REITs with exposure to foreign currencies will inevitably experience drag from a stronger SGD. The investor needs to factor this when considering a REIT with non-SGD exposure. In many cases, the growth prospects of the REIT may more than compensate the effect of the currency drag, more so in many emerging markets such as China, India and South East Asia. 

However, for REITs with Developed Market exposure, such as the US, Canada, Japan, European Union and Australia, growth prospects are more muted. The currency effect is likely to be a more significant component (either positive or negative) of total returns. As such, investors need to consider the currency drag, particularly when looking at REITs with minimal or zero rental reversion.

Hedging. While currency hedging provides some visibility in the short term, it is only delaying, not preventing the impact of currency changes. This is because the earnings are only hedged for the duration of the hedge, and when the hedges expire and have to be rolled over, the DPU will be exposed to the prevailing exchange rate. 

Summary

In the long run, it is important to keep in mind that Singapore's strong current account surplus has been the major driver of SGD strength over the decades. Should these driver remain intact for the foreseeable future, MAS will continue to ensure that the SGD appreciates in a steady and gradual manner. As a result, investing in REITs with non-SGD will inevitably result in a currency drag of 1-2% per annum in the long run. While not a major issue, this could potentially affect REITs with stagnant or minimal DPU growth, and needs to be incorporated as a factor when making investment decisions. Hedging only delays the effect of exchange rates changes, not prevent it. 


Share:

Sunday, March 3, 2019

S-REITs Jan-Feb 2019 Review


S-REITs have been on tear this year, outperforming the broader market by a wide margin. Economic and market conditions have been optimal for a REIT rally. These conditions include falling bond yields due to expectations of looser monetary policy by major central banks as compared to the last 2 years. Also, a weaker economic outlook, but not quite a recession, means that growth stocks which were in vogue over the last few years, have lost their shine. 

Instead, institutional investors have turned their attention to dividend stocks, since they anticipate lower capital gains from growth stocks. Also, appetite among global investors for Asian equities have returned in a very strong manner. These factors have been the driving force behind the stampede into S-REITs this year.

So how have S-REITs stacked up so far? 

The table below shows the total returns of the S-REIT sector for the first two months of the year. While no sub-sector has outperformed in particular, the Industrials have underperformed, despite their higher yields. This is likely due to the still-pessimistic outlook for this sub-sector, more so if economic growth worsens.

The higher beta REITs have outperformed, though they were also the most battered in the sell-off last year. In the top 10, the only REITs with a majority of assets based in Singapore is CapitaLand Commercial Trust and to a lesser extent, Keppel DC REIT. The other REITs are 100% offshore assets, with the exception of Ascendas Hospitality Trust holding a single Singaporean asset.

Also, the China plays have been stellar as a resolution on the trade war looks increasingly likely, notably Sasseur REIT (19.2%), Mapletree North Asia Commercial Trust (11.4%), CapitaRetail China Trust (11.0%) and EC World REIT (10.1%). I expect the Chinese REITs to continue to outperform should a trade deal materialise. This is largely due to aggressive monetary and fiscal policy stimulus that the government unleashed in late 2018. As government policies tend to take a few months to kick in, the Chinese economy will rebound as early as the 2nd Quarter of 2019.

Where do we go from here?

Any further rally in the REIT sector as a whole will hinge on Federal Reserve policy changes over the next few months. If the Federal Reserve does indeed pause its rate hikes for good and ends it balance sheet reduction (read 'money destruction'), we can expect bond yields to head lower once more and the S-REIT rally to resume. But for now, I believe that the rally is done, though I expect prices to move sideways, or even undergo a minor correction, pending further development from the Federal Reserve. 

Share:

Friday, February 22, 2019

IREIT Global (SGX:UD1U) 4Q18 Review


While 4Q18 results did not spring any major surprises, I noticed several salient points regarding IREIT Global (IREIT). Please refer to my initial piece here.

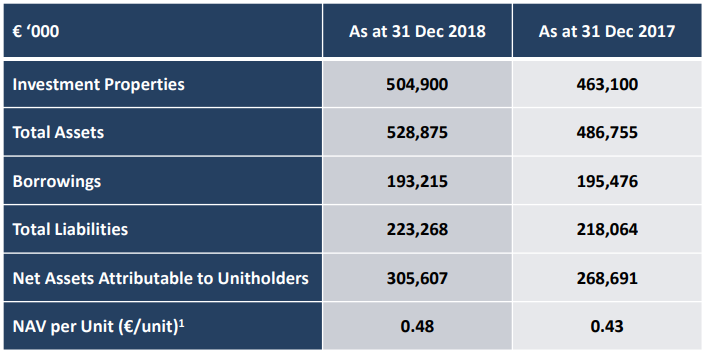
Gearing continues its gradual slide on upward revaluation of assets. As per the quarterly presentation, IREIT’s upward revaluation of its buildings accounted for the reduction of gearing. This is not surprising as rising rental rates in the office market and declining capitalisation rates (cap rate) in Germany has led to higher asset values. While its high gearing levels was always cited as a concern, I believe that the current level (36%) provides the REIT with some breathing room.


Loan has been refinanced at a lower rate, though borrowing sum has increased marginally. IREIT refinanced its outstanding loan of EUR 193.5 million with an 2.0% interest rate successfully with a new loan of EUR 200.8 million with a 1.7% effective interest rate. This lower interest rates will reduce the REIT’s interest expense by EUR 456k a year, though negligible on the REIT’s DPU level (0.07 cents).

However, to me, an  interesting piece of information is the tenure of the loan, that is a 7-year loan maturing in 2026. It is somewhat unusual for a bank to offer a loan beyond the lease profile of tenants. This either speaks of the bank’s lax credit policies, or perhaps, it is comfortable with the assets of the REITs that are presumably used as collateral for the loan. Which leads me on to the next point.


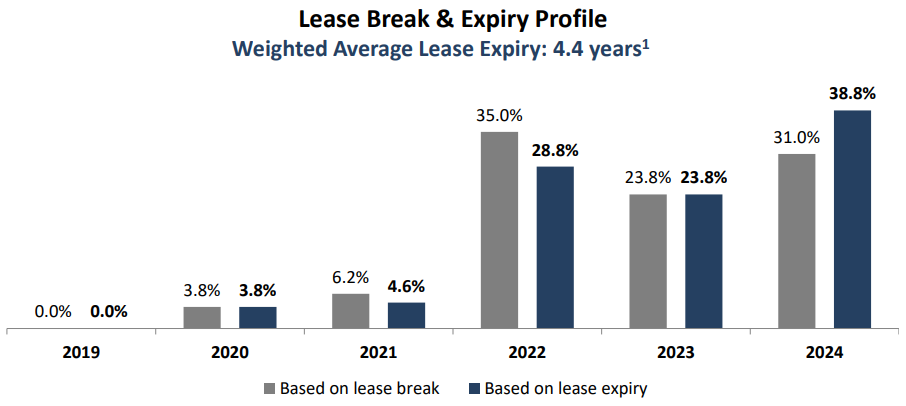
Office market remains hot in Germany. Vacancy rates continue to plummet in Germany as office take-up outstrips new supply of construction. Despite the hot property market, cosntruction activity remains subdued. This is important to note as it points to the likelihood that vacancy rates will remain low in the coming years, on the back of low supply of new office buildings. This is favourable for IREIT as its leases approach expiry in 2022. Should the office market remain tight and rental rates remain on an upward trajectory, the investor need not fear a concentrated tenancy profile. In fact, as highlighted in my previous post, IREIT may be a deep value stock, as investors can expect a jump in DPU come 2022. 

 Refer to the reports from JLL and Cushman & Wakefield for research details on the health of the Germany office real estate market.

Exchange rates on a downtrend. The Euro has been on a weakening trend over the last year due to a combination of politics and weaker economic data. The dividends for 2018 was hedged at 1.63, while the EUR/SGD has been declining steadily through 2018 and currently stands at 1.54. As IREIT hedges its dividends one year in advance, this implies that the the dividends for 2019 will be converted at progressively weaker levels. For this precise reason, I am not in a hurry to buy this REIT, and intend to accumulate in periods of sharp corrections, perhaps when the price is closer to 70 cents.


Conclusion

IREIT remains a deep-value REIT although in the short term, I am concerned about the effects of the weakening Euro. I am in no hurry to add this REIT to my portfolio, though it remains on my to-buy list should this REIT experience a correction.
Share:

Thursday, January 31, 2019

IREIT Global (SGX:UD1U)


Germany's office real estate has been on a roll over the last few years. Judging from its share price, IREIT Global (IREIT) was deep in slumber amidst the real estate frenzy. I will examine this much unloved and non-covered REIT, as it offers an interesting, albeit long-term value proposition. This is a reversal of my usual investment thesis, where I tend to prioritise macroeconomic factors over company specific ones. 

Summary of Investment Thesis

Strengths
  1. Rental rates and book value are below market rates
  2. Robust office market in Germany
  3. Brexit may lead to companies relocating to Germany
Weaknesses
  1. EUR is vulnerable to Europe's political turmoil
  2. Tenant risk concentration
What does IREIT do?

IREIT is a pure-play office REIT consisting of five office buildings located in various cities across Germany, with the largest contributor being its Berlin Campus. The REIT was listed in 2014, and the Berlin campus was subsequently injected in 2015, with no further additions since then.


The REIT's management has changed hands in 2016, when Tikehau Capital acquired 80% of the REIT manager from the previous sponsor. The previous Sponsor who carried out the IPO is an Israeli investor into European office assets. Tikehau is a pan-European Asset manager and investor and is listed on the Euronext Paris (Bloomberg Code - TKO:FP).

Change in mandate. Subsequent to the acquisition, Tikehau announced that IREIT's mandate will be broadened to include European retail and industrial assets. However, there has been no addition to IREIT since the Berlin Campus in 2015, leaving it a pure play German office REIT at present.

Shareholders. IREIT's largest shareholder is Tong Jinquan, a Chinese tycoon, with a 55% stake at present. The stake was acquired as part of the IPO, from the previous sponsor. Tong Jinquan's stake has remained largely unchanged since the IPO. On the other hand, Tikehau has gradually increased its stake in the REIT since becoming the REIT's manager in 2017. At present, Tikehau owns 8.3% of the REIT. I view this gradual increase as an encouraging sign, as it increases the alignment of the REIT manager with that of unitholders.

Macroeconomic Outlook

Germany's inflation has been stable. IREIT's leases are generally inflation-indexed, that is periodically adjusted when cumulative inflation reaches a threshold between 5-7% for the leases. The ECB’s Governing Council adopted a quantitative definition of price stability in 1998:

"Price stability is defined as a year-on-year increase in the Harmonised Index of Consumer Prices (HICP) for the euro area of below 2%."

The Governing Council clarified in 2003 that in the pursuit of price stability it aims to maintain inflation rates below, but close to, 2% over the medium term.  Inflation pressure in Germany has averaged 1.5% per annum over the last 20 years, indicating that the ECB has been able to meet its goal in the long run, at least for the German economy.

German office rental market has been running red hot over the last few years, with a robust economy generating new jobs and unemployment rate hitting record lows consistently. The steady growth of jobs and workers in the economy has resulted in office vacancy rates falling rapidly in major cities.

Interestingly, though vacancy rates have been declining steadily since 2012, rental rates started to surge from 2015 onwards. This indicates that the market tightness only set in once excess supply has been absorbed. The brightly coloured lines in the charts are the cities that are relevant to the REIT, while the grey lines are for the other major cities in Germany. Reuters has highlighted the shortage of office space in Berlin.


Brexit Catalyst. Naturally, investors will be wondering, can this spike in rental rates continue? I believe that it is possible, given that German office rental rates are much lower than that of the UK and France. A key catalyst that investors have not factored in is that a hard or messy Brexit could lead to a flood of companies seeking to relocate to mainland Europe. While France is likely to be the main beneficiary of any exodus, German cities will also be a recipient of some corporates seeking to relocate. Should this materialize, this outcome will be impetus for further increases in office rental rates.

Economic Outlook for Europe and the Euro (EUR). The economic outlook for Europe is rather bleak, given the aging population, deteriorating social cohesion and political turmoil. Events such as Brexit, while may be beneficial for IREIT, bodes poorly for the grand European project and it's single currency in the long run. In my opinion, politics beyond Germany's borders is likely the biggest threat to the long term performance of this REIT, as the EUR's existence may be called into question. As shown below, the trajectory of the EUR appears to be that of a weakening trend against the SGD since the Global Financial Crisis.

Company Analysis

Given the overwhelmingly positive backdrop of the German office market, why hasn't IREIT's unit price moved positively? My answer to this question is, investors in Singapore and Asia are still oblivious, as they remain focused on IREIT's DPU, which will remain largely flat (at least in EUR terms) until 2022 at earliest, with a periodic bump up due to inflation-adjustments.The chart below captures how monotonous the REIT's revenue and NPI have been since the Berlin Campus acquisition in 2015, with any fluctuations largely due to changes in the EUR/SGD rate.

DPU rose after 2015 following the acquisition of the Berlin Campus, but declined in 2017 as the new REIT manager, Tikehau, revised the distribution rate to 90% from 100% previously. The DPU has remained stable since then, with any changes due to fluctuations in the exchange rate. Looking forward, the DPU can be expected to decline in 2019, as the EUR weakened in 2018 against the SGD. The currency hedge is expected to roll over at a lower rate, with my estimated 2019 hedged exchange rate of 1.57, as compared to 1.63 for 2018. This is a 3.7% reduction in DPU in SGD terms.


IREIT's long lease profile. At the point of IPO in 2014, IREIT's properties have always had a long lease profile. The leases for the original properties were structured with no rental escalation, save a periodic inflation adjustment. This lease structure has left the DPU relatively stable, albeit unexciting.


The bulk of the leases will start to expire commencing 2022.


Based on the table below, we can see that the Berlin Campus, with a 40% weight in the REIT, has the widest gap between market rental rates and the present lease rate for the asset.  IREIT's leases are generally far below the average market rental rate. This presents an opportunity for a bump up in DPU in 2022-2024 as the leases are renewed at prevailing market rates.


Source: Colliers

In terms of book value, the assets are likely to be undervalued. This is because the book value of real estate are commonly valued on the basis of NPI divided by the capitalisation rate. As IREIT's NPI will be adjusted upwards when the leases are renewed, the book value of the assets should be higher. Thus, the NAV of IREIT is likely to be understated.

Although there have been concerns that the REIT is highly leveraged (Sep-18: 39.1%), given my view that the assets are undervalued, the true debt-to-asset ratio is likely lower than that of the book value. In any case, the ratio has been gradually drifting downwards from the high of 43.4% reached post-acquisition of the Berlin campus in 2015.  This gradual improvement is due to the 10% retention of distributable income, paring down of debt and gradual upward revaluation of properties as Germany's capitalisation rate has been declining amid falling interest rates.


REIT Management Fee Structure
  1. Management Fee-
    • Base Fee: 10% p.a. of Annual Distributable Income
    • Performance Fee: 25% p.a. of the difference in DPU between a financial year and the prior year
  2. Acquisition Fee - 1.0% of the value of real estate investment purchased or acquisition price 
  3. Divestment Fee - 0.5% of the value of real estate or sale price 
  4. Trustee Fee - 0.01% p.a. of trust property value 
The performance fee ensures that the REIT manager's and unitholders' interest are aligned since the REIT manager is incentivised to pursue DPU-accretive deals. Nevetheless, despite the change in REIT manager and broadening of the mandate in April 2017, the REIT has shown little appetite for new acquisitions.

Conclusion


IREIT is a deep-value REIT, with a potentially significant upward revision of DPU in 2022 and beyond as the leases are renewed. The primary short term risk for IREIT unitholders appears to be a weakening EUR, as DPU for 2019 will be lower than 2018. IREIT remains an excellent stock to hold if you are only looking for dividends, as any DPU growth can be expected in 2022 and beyond. The stock has been trading with a dividend yield of 7-8% over the last few years.
Share:

Friday, January 25, 2019

Ascendas India Trust (SGX:CY6U) 4Q18 Review


This is a quarterly update to my previous write-up on Ascendas India Trust (AIT). AIT reported stellar results, even in SGD terms, considering the steep decline of the INR versus the SGD. The INR slid by 9.8% over the comparable quarter a year ago. NPI rose by 14% in INR terms, and 4% in SGD terms.

Economic Outlook

The outlook for the INR is more positive for 2019, following a turbulent year for Emerging Markets in general. India's Current Account Deficit should narrow this year, as crude oil prices have plunged. As India is a net importer of crude oil, lower oil prices strongly benefits the Indian economy and reduces its import bills. Also, other external factors such as the end of the US Federal Reserve interest rate hike cycle, will ease pressure on Emerging Market currencies. However as we will see below, AIT still managed to generate decent returns in SGD terms despite the rough year for the INR.

The Indian economy is quite insular, unlike the other major economies of Asia that are heavily dependent on exports and broader global economic growth. The country is a net importer, resulting in a persistent current account deficit. While this insularity has hampered growth in the past, this cushions the economy from the worst of a global economic slowdown. The ongoing trade war between US and China is expected to have little impact on India regardless of the outcome. In addition to that, India is Asia's fastest growing major economy, growing above 7% annually, and is expected to keep that position as China continues to slow down.


Company Analysis


In NPI terms, AIT continues to demonstrate solid growth, with the growth trajectory set to be sustained in coming years. Strong rental reversion driven by a robust Indian economy and a healthy pipeline of assets under development remain the primary growth drivers for AIT.

Quarterly dividends continue to rise, following the private placement of shares in 2018, acquisition of new assets and strong rental reversions. This is an example of a management undertaking accretive acquisitions that seem to be frankly, quite lacking in the S-REIT space as of recent years. Note that over the last few years since 2014, AIT has been able to increase its floor space and DPU consistently by raising equity and debt in the right proportions so as to not stretch the balance sheet. 


Total debt-to-asset ratio remains comfortable at 33% (statutory limit: 45%), giving the REIT headroom to grow further.


Long-term prospects secured by steady pipeline. The asset pipeline as of 31st December 2018 points to AIT's floor area rising to 20.1 million square feet from the present 12.6 million square feet. On 3rd January 2019, Ascendas-Singbridge announced the acquisition of a parcel of land in Chennai to develop a new IT park, with a potential floor space of 2.3 million square feet. This represents potential assets that could eventually be injected into AIT, boosting the pipeline to a potential 22.4 million square feet.


Acquisition of Ascendas-Singbridge by CapitaLand. AIT will come under the CapitaLand stable of REITs following the merger. As CapitaLand has no meaningful presence in India or overlap in terms of business operations with Ascendas-Singbridge in that market, I do not expect this merger to materially change AIT's business model or fundamentals.

Summary
AIT remains fundamentally solid, with the latest quarter results affirming its growth story. With the INR expected to be on a stronger footing this year, the drag on DPU growth should be lower this year. In an environment of weak or zero DPU growth for the overall SREIT sector, I expect AIT to be one of the better performers.
Share:

Tuesday, January 8, 2019

Parkway Life REIT (SGX:C2PU)


I personally view Parkway Life REIT (PLife REIT) as a benchmark REIT when evaluating not just the SREIT sector, but also when looking at MREITs and HKREITs. It is one of the few healthcare REITs available in the region, and by far the best in terms of asset quality and DPU outlook. Its earnings and dividends are very stable due to the nature of its leases.

Summary of Investment Thesis

Strengths
  1. DPU growth is like clockwork - NPI grows at a minimum of 0.6% per annum on average
  2. Very long lease profile ensures stability- Singapore leases are on a 15+15 years basis (commencing 2007) while Japanese assets have an average lease tenure of 12.64 years
  3. Strong demand for premium healthcare in the region - Singapore is a leading medical tourist hub for the region's high net worth individuals.
Risks
  1. Japanese asset prices/rental rates may suffer from deflation
  2. DPU may be affected in 2022-2023 when hedges related to the JPY exposure are rolled over

What does PLife REIT do?

PLife REIT holds Singapore's premium healthcare facilities, a private Hospital in Malaysia and nursing homes in Japan. Its Singaporean assets account for the bulk of revenue, followed by its stable of Japanese nursing homes. Its sole Malaysian asset contributes less than 0.4% of NPI for 2018, and I will exclude it from my analysis due to immateriality.

It's Singaporean hospitals, primarily Mount Elizabeth and Gleneagles, cater to the affluent segment of Singaporean society, expats and medical tourists from South East Asia and beyond. PLife REIT has signed a lease agreement with IHH for 15 + 15 years with effect from 23 August 2007 on a triple net lease basis. CPI + 1% rent review formula for Singapore Hospital Properties guarantees minimum 1% growth annually (CPI deemed as zero if it is negative). This arrangement ensures that the Singaporean assets have an occupancy rate of 100% and rental growth of at least 1% per annum for the entire duration of the lease period.

The operational statistics below, while bearing no direct impact on the REIT due to the triple net lease structure, points to the role of PLife REIT in its Sponsor's (IHH Healthcare Berhad) growth trajectory. Thus we can be assured that the Sponsor's business interest is aligned with the REIT, and that an eventual non-renewal of the lease by the Sponsor is highly unlikely given the importance of the REIT's assets to the Sponsor.


The Japan portfolio consist of long-term leases with weighted average lease term to expiry of 12.64 years as of September 2018. The portfolio has exposure across Japan, consisting of 1 pharmaceutical product distributing and manufacturing facility and 45 private nursing homes. PLife REIT has been gradually expanding its footprint across Japan since 2012.


Macroeconomic Outlook
Singapore

Rising affluence in South East Asia provides a growing customer base. Singapore is a healthcare hub for South East Asia, attracting medical tourists from the affluent segments of the region. The rapid growth of this segment in South East Asia as a whole provides an expanding customer base that PLife REIT is well positioned to capture. The chart below is derived from Credit Suisse's Global Wealth Report 2018 on the rise of the wealthy in Asia, which augurs well for PLife REIT in the longer run.


Benign but positive inflation outlook. As the Parkway Singapore master leases are tied to the Consumer Price Index (CPI), it is important to understand the factors that drive the CPI. Over the last few years, the overall index paints a picture of rather weak inflation and we shall take a quick peek under the hood to better understand the factors that drive inflation.
Generally, the bulk of variability in the CPI can be attributed to changes in the Housing & Utilities (yellow) and Transport (green) components. Further digging reveals that the housing & utilities component is closely correlated to rental rates while the transport component is linked to changes in the premium of a Certificate of Entitlement (COE). The other components, such as food and education form the base for a consistent source of inflation pressure of about 0.6% over the last few years, which I would deem to be a rule-of-thumb indicator of long-term core inflation.

Residential rental rates are starting to rise. Due to a reduction in expats from the traditionally well-paying financial and oil & gas sectors, this has resulted in rental rates falling across Singapore. While the actual number of foreigners have increased over the years, the composition of workers have undergone a shift, with fewer highly paid expats in the market. This has translated into gradually declining residential rental rates. As housing cost is calculated using the imputed rent method for measuring inflation, even if you are living in your own property, your housing cost is deemed to have decreased if the overall rental rates fall. As such, there is a very strong correlation between the URA Rental Index and CPI Housing & Utilities component. It appears that changes in the rental market has a much stronger impact than increases in utilities. Following the peak in 2014, the URA Rental Index has been on a steady decline but it appears to have bottomed out in 2017 and climbed modestly in 2018.


Are COE premiums bottoming out? Although COE premiums have been trending downwards over the last few years, this is largely due to the increase in COE supply due to the deregistration of existing vehicles. It appears that the deregistration of existing vehicles will fall off sharply between 2019-2020, and if no new growth of vehicles is permitted, COE premiums can be expected to start rising again in 2019. However, the impact of changes in COE premiums on the CPI Transport component has weakened since 2014, which indicates that there was probably a change of weights when the CPI Index was re-balanced in 2014.


Strange as it may sound, PLife REIT's rental reversion ultimately hinges on two totally unrelated variables- residential rental rates and COE prices. The outlook for residential rental rates appear to be on a mild uptrend, though no acceleration should be expected given the lukewarm economic climate. Meanwhile, COE premiums are likely to turn higher in 2019 due to a the expected cyclical fall in vehicle deregistration. A combination of rising rental rates and COE premiums will exert upward pressure on the CPI up for 2019 and 2020, which bodes well for PLife REIT's DPU growth over the next two years.

Japan

Aging demographics. As the most aged country in the world, Japan has a median age of 47.3. On the surface, it may seem like an unbridled positive given PLife REIT's portfolio of nursing homes in Japan, in reality it is a doubled-edged sword. Why does deflation matter? Because it exerts downward pressure on rental rates and asset prices in general. Unlike Singapore, Japan struggles with structural deflation due to its aging population that is expected to shrink at an accelerating rate.


Despite that, inflation in Japan has remained positive due to the Bank of Japan's monetary policy in the form of massive money printing, known as Quantitative and Qualitative Monetary Easing (QQE) program. While the scope of Japan's monetary policy is too complex and lengthy to be discussed here, it should be sufficient to stave off deflation in Japan for the foreseeable future, though not by a large margin. While PLife REIT's Japanese assets have downside risk protection, which protects unitholders, there is little upside for rental rates either. As of 3Q18, only 13.2% of the REIT's Japan's assets by revenue are subject to market revision while the rest are downside protected. My view is that since the Bank of Japan has been pursuing its goal of 2% inflation rate quite doggedly over the last few years through massive monetary stimulus, though with limited success. we can expect inflation to remain above 0% in the longer term.


Company Analysis


Sponsor - IHH Healthcare Berhad (IHH)

PLife REIT is backed by IHH, a leading healthcare group in South East Asia, and is dual listed on the Singapore Exchange and Bursa Malaysia. The group has recently undergone changes in terms of its largest shareholders in November 2018. The largest shareholder, Khazanah Nasional Berhad (Khazanah), Malaysia's sovereign wealth fund, sold 16.0% of its stake to the second largest shareholder, Mitsui & Co Ltd (Mitsui), a Japanese conglomerate, leading to a swap in their shareholding positions. Post-transaction, Mitsui's stake rose to 32.9% while Khazanah's shareholdings was reduced to 26.05%. I do not expect the transaction to impact PLife REIT's strategic direction, since both the companies have been long-term shareholders of IHH. This disposal is in line with the new Malaysian government's decision to pare down its stake in its major shareholdings, rather than as a statement of its view of IHH. In the same vein, Singaporean investors would have noticed that Axiata (majority owned by Khazanah) has decided to sell its stake in M1. Ultimately, what matters most to unitholders is that the Sponsor has not acted in any way that is detrimental to unitholders since its IPO in 2007.


Financials

Due to the long leases of all its assets, PLife REIT's financials are remarkably stable. The NPI breakdown shows that the Singaporean hospitals form the bedrock of the REIT, with its relentless and stable growth while the Japanese assets show some variability.

A steadily rising NPI has translated into an uptrend for DPU, though the DPU for 2015 and 2017 were bumped up by the distribution of realized capital gains upon disposal of some Japanese assets. DPU growth for the Singaporean assets are driven by the rental reversion factor of CPI + 1%. As the Singaporean assets contributes to 60% of NPI, we can expect growth for the overall NPI to rise by 60% X (CPI + 1%), leading to a minimum annual growth of 0.6% of NPI if the CPI is zero or negative. As the 'core' inflation for Singapore stemming primarily from Food and Education components discussed above has averaged 0.6% per annum, we can assume an average inflation rate of at least 0.6% in the long run. Based on this assumption, I expect the Singapore assets NPI to grow by 1.6%, and for overall NPI to rise by approximately 1.0% per annum. Likewise, DPU growth should track the underlying NPI growth. However, due to proactive management with acquisitions/disposals of various assets in Japan, this has led to DPU growth outpacing the automatic rental escalations imputed into the Singapore leases.


Comfortable and sustainable debt. Although the REIT has sizeable JPY debt, the management has utilized various swaps to hedge currency and interest rates exposure. As of September 2018, the REIT has hedged its JPY exposure until the first quarter of 2023, ensuring minimal interest and currency risks until the hedges are rolled over (industry jargon for renewing a hedge) then. The REIT has an average debt maturity of 3.1 years and a low average cost of debt, 0.94%, due to the low interest rates in Japan. At the point when the hedges have to be rolled over , depending on prevailing exchange and interest rates at that point, the REIT could incur considerably higher or lower interest expense then. Until then, interest expense is will remain very stable, though the REIT will not benefit if interest rates decline in the event of an economic slowdown or recession. The REIT's gearing level has remained below 40% over the last few years. 


REIT Management Fee Structure
  1. Management Fee-
    • Base Fee: 0.3% p.a. trust property value
    • Performance Fee: 4.5% p.a. of trust's net property income 
  2. Acquisition Fee - 1.0% of the value of real estate investment purchased or acquisition price 
  3. Divestment Fee - 0.5% of the value of real estate or sale price 
  4. Property Management Fees - 5.0% of capex for projects of capex less than S$1.0m, 3.0% of capex for projects of capex more than or equal to S$1.0m
PLife REIT's management fee structure does not fully align the interest of unitholders and that of the REIT management because the management incentive fee is based on NPI growth, rather than DPU growth. Under some circumstances, such as an absence of accretive opportunities, the management may be tempted to undertake DPU dilutive acquisitions just to boost DPU at the expense of unitholders. However, as PLife REIT has demonstrated a solid track record of managing this REIT and has not pursued any deals that have been detrimental to unitholders, I am not overly concerned by the fee structure. 

Conclusion

This is one boring REIT which will rarely spring a negative or positive surprise in its quarterly earnings. Its DPU ticks upward annually in an almost clockwork fashion due to the Singaporean assets' rental escalation of CPI + 1%. If you are looking for an investment with income (dividends) that is almost bond-like, but with some growth, look no further. I believe that PLife REIT deserves a place in any REIT or dividend portfolio to provide a stable and growing dividend stream.

For market data on this REIT and comparison against the market, please refer to my compilation of REITs here.

Disclaimer: I hold a position in this REIT at the point of writing. 
Share:

Tuesday, January 1, 2019

Ascendas India Trust (SGX:CY6U)


Ascendas India Trust (AIT) is an underrated gem in the Singapore REIT space. While I understand that certain investors might have some apprehension about having Indian exposure, due in part to the volatile and constantly depreciating currency, the bright growth prospects and strong sponsor has been more than enough to offset these risks. Although this REIT tends to draw less attention than the blue-chip REITs under the Mapletree and Capitaland stables, I personally feel that this REIT deserves a place alongside them.


Summary of Investment Thesis

Strengths
  1. Bright growth prospects driven by favourable Indian demographics and global offshoring trends
  2. Strong sponsor support - Ascendas-Singbridge is backed by Temasek and JTC
  3. Clear pipeline of assets under development - Strong earnings growth visbility thanks to robust pipeline of buildings under development
Risks
  1. Structural Indian Current Account Deficit - This causes the INR to be on a persistent and long-term depreciating pathway against major currencies, which erodes DPU growth in SGD terms. In years of severe depreciation, DPU in SGD terms may fall

What does AIT do?

AIT is a real estate investment trust (REIT) that holds 7 IT Parks and 6 warehouses across India. This REIT is a play on India's growing role as a Global IT center and leading offshoring hub for service. For example, AIT announced in May 2018 the acquisition of a building in Hyderabad, aVance 6 that is 98% leased to Amazon. The REIT has a strong growth pipeline, as it has properties under construction that will contribute to the REIT's NPI upon completion over the next few years.


Macroeconomic Analysis

Steady and bright growth outlook. In a world of slowing economic growth, India stands out as an increasingly important growth driver. While China will continue to grow, its best years of breakneck economic growth is likely behind it. Also, India's demographic profile is considerably more favourable than China, which points to decades of strong growth ahead. In comparison, the full impact of China's One Child Policy enacted decades ago will weigh on economic growth in the coming decades. Also, given the relative isolation of the Indian economy (being less integrated into the global economy as compared to the heavily export-oriented nations of the Far East), this growth is less likely to be affected by global economic disruptions. 


Strong economic growth usually translates into rising demand for commercial real estate, which in turn pushes valuations up and drives positive rental reversion. Also, it implies a growing pie, which is beneficial for all players involved, lowering the degree of competition in the market. India's strong economic outlook bodes well for AIT which is well positioned to benefit with its long pipeline of assets to be added.

Offshoring of global IT services to India. India has positioned itself as an offshore hub for IT services. The primary driver behind this offshoring trend is the large supply and lower wages of IT personnel in India. According to PayScale, the average IT programmer commands an annual salary of USD 6,215, compared to USD 6,813 in the Philippines and USD 61,176 in the US. As indicated by the pie chart below, American corporations dominate with a 59% share of AIT's rental income, followed by French corporates at 9%. Local corporations account for less than a quarter of AIT's rental income.


While there has been strong push-back in the US against the offshoring of manufacturing to the Far East, there has been virtually zero political backlash against the offshoring of services to Asia. This is likely because the segment of labour being displaced is more mobile (educated/skilled) and less likely to demand for populist measures at the ballot box. As such, there is unlikely to be any political impediment towards this trend of American and European based corporations shifting their IT operations to India.

Structural Current Account Deficit. Lacking a strong manufacturing base, India has been running a Current Account Deficit for decades as a result of its imports far exceeding its exports. In the long run, this structural current account deficit has resulted in a persistent depreciation of the Indian Rupee (INR). The chart below demonstrates the relationship between the Current Account Deficit and the INR. It can be seen that when the Current Account Deficit widens, the INR tends to weaken and stabilizes during periods when the Current Account Deficit improves.

Between 2009 and 2013, when the Current Account Deficit worsened sharply, the INR depreciated in line. This impacted AIT's earnings during those years, though the strong rental income growth offset the weaker INR. Since 2013, the Indian government has taken steps to curb the Current Account Deficit, such as raising import duty on gold, a major source of the Current Account Deficit. While the Indian government has had some success in reducing the Current Account Deficit, I do not expect it to be eliminated in the next few years. This implies that the INR is expected to continue depreciating gradually, though nowhere nearly as severe as experienced in 2009-2013.

This factor is arguably the largest headwind for AIT since its income is 100% denominated in INR while all distributions are repatriated to unitholders in Singapore Dollars (SGD), and is likely a reason for many potential investors to gloss over this name. From a macroeconomic perspective, investing into AIT is a wager that the rental income growth (in INR terms) will significantly outpace the expected FX losses due to INR depreciation.

Company Analysis

Sponsor (Ascendas-Singbridge Group)

Ascendas-Singbridge is jointly owned by Temasek Holdings and JTC Corporation. Both entities are wholly-owned by the Government of Singapore and their REITs have been well managed over the years. Among the chief concerns plaguing S-REITs have been management pursuing Mergers & Acquisitions (M&A) deals that have been non-accretive to REIT unitholders, or at worst, dilutive to investors. While some IPOs in recent years have been attempting to discourage such behaviour by aligning the interest of unitholders and REIT managers, I am of the view that the character of the Sponsor is key in preventing such behaviour. 

While AIT's incentive structure for management is not quite aligned with unitholders (discussed further below), the management has not undertaken any DPU dilutive deals since their IPO in 2007. I personally feel that having a strong sponsor is a vital ingredient in sustaining growth in the long-term.

Growth Outlook

AIT has grown steadily, in terms of property acquired/constructed since its IPO. As of September 2018, the REIT has a total commercial space of 12.6 mil square feet, and is poised to rise to 20.1 mil square feet over the next few years. This points to a strong NPI and DPU growth outlook over the next few years.


AIT has sufficient debt headroom to finance this gradual expansion. Its gearing ratio stands at 32% presently, quite comfortably below the 45% limit set by the Monetary Authority of Singapore (MAS). The REIT has an average debt cost of 6.1%, based on borrowing ratio of 62% in INR and 38% in SGD as at 30 September 2018. As Indian interest rates are expected to decline as the economy develops gradually, AIT's borrowing costs can be expected to gradually fall in the long run.


Income Analysis

AIT has demonstrated a strong track record in terms of generating Net Property Income, particularly in INR terms (red bars below). In SGD terms, the REIT's NPI has been somewhat less impressive particularly through the years of 2008 and 2012. This is largely due to the reasons mentioned above regarding the macroeconomic environment driving the SGD/INR, and not factors specific to the REIT.


In terms of distributable income, AIT fared poorly through the period of 2008-2012 due to a combination of higher interest costs, higher dividend distribution taxes. However, distributable income has shown steady recovery since 2013 as the negative factors that weighed on the REIT in the earlier years receded. Also, the REIT reduced its distribution from 100% to 90% since 2013, which allows the REIT to gradually strengthen its balance sheet via income retention. 


REIT Management Fee Structure
  1. Management Fee-
    • Base Fee: 0.5% p.a. trust property value
    • Performance Fee: 4% p.a. of trust's net property income 
  2. Acquisition Fee - 1.0% of the value of real estate investment purchased or acquisition price 
  3. Divestment Fee - 0.5% of the value of real estate or sale price 
  4. Trustee Fee - 0.02% p.a. of trust property value 

AIT's management fee structure does not align the interest of unitholders and that of the REIT management because the management incentive fee is based on NPI growth, rather than DPU growth. Under some circumstances, such as an absence of accretive opportunities, the management may be tempted to undertake DPU dilutive acquisitions just to boost DPU at the expense of unitholders. As India's property yields remain high by global standards, the risk of AIT's management undertaking dilutive acquisitions is low for the forseeable future.

Conclusion

AIT is a play on several very positive long-term growth drivers, notably India's bright growth prospects, and the offshoring of IT services by MNCs. However, the risks include India's persistent Current Account Deficit, which has led to a long-term depreciation pathway for the INR and higher interest rates. In years of particularly severe depreciation such as in 2012, the depreciation may outweigh NPI growth, leading to lower DPU in SGD terms. On the other hand, having a strong sponsor with a solid track record helps to mitigate the challenges of operating in an Emerging Market like India.


For market data on this REIT and comparison against the market, please refer to my compilation of REITs here.

Disclosure: At the point of writing, I am long AIT. I intend to hold this position for the long-term.
Share: